

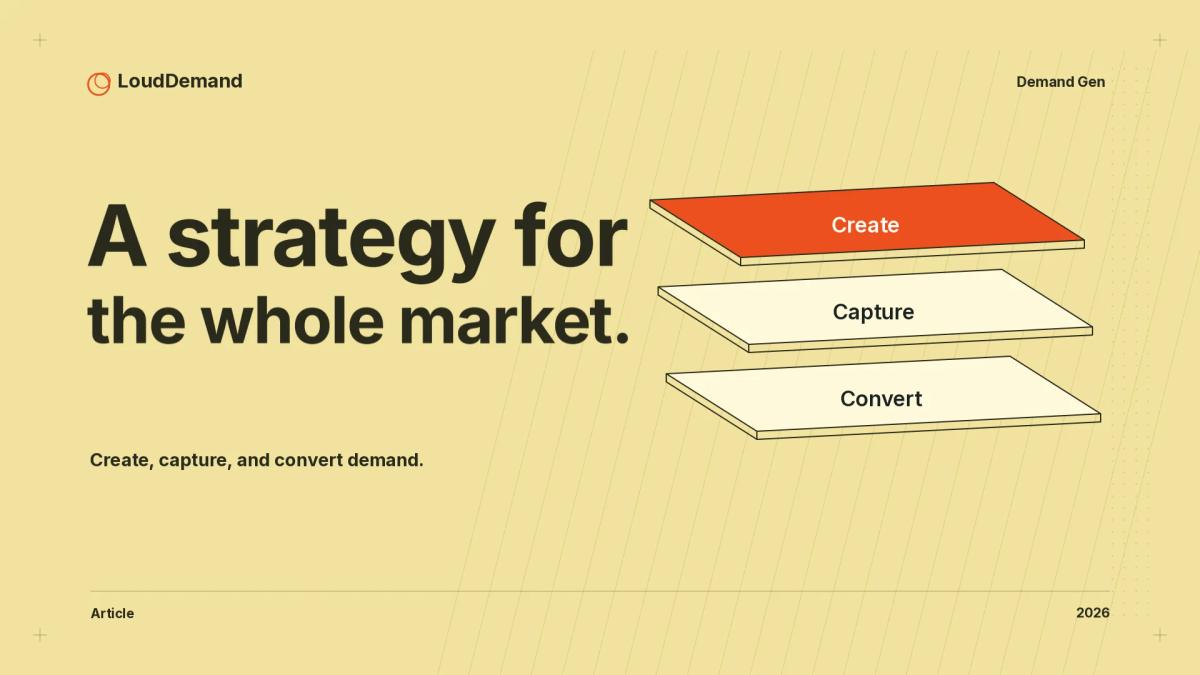
A B2B demand generation strategy is five decisions made in a fixed order: the buyer you will win, the claim you can defend, where the money goes, what the buyer takes next, and what counts as proof. In 2026 that order is most of the job, because marketing budgets sit flat at 7.8% of company revenue, 15.3% of that budget is already committed to AI, and only 30% of marketing organizations report the maturity to use it. Pass the five gates in sequence and your channel list, budget split and dashboard become consequences rather than a shopping list.
Why strategy-setting is the whole job in 2026
Four things changed at once, and together they turned tactic collecting into a luxury most teams can’t afford.
Budgets stopped growing. Gartner’s 2026 CMO Spend Survey (401 CMOs, fielded January–March 2026) found marketing budgets flat at 7.8% of company revenue, up a rounding error from 7.7%, and 56% of CMOs saying their organization lacks the budget to deliver its 2026 strategy. Every new line item must be funded by killing something else.
The AI money is real but premature. The same survey put 15.3% of marketing budget into AI initiatives and found only 30% of marketing organizations report mature AI readiness. Gartner’s June 2026 read adds that 70% of CMOs say their processes aren’t mature enough to scale AI, and that labor’s share of marketing budget rose from 21.9% to 24.5% as AI spend rose.
Buyers changed where they start. G2’s 2026 Answer Economy report (1,076 B2B software buyers, March 2026) found 51% of B2B software buyers now begin research in an AI chatbot more often than with Google, up from 29% eleven months earlier. Sixty-nine percent chose a different vendor than planned based on the chatbot, and a third bought from a vendor they had never heard of.
51% of B2B software buyers now start their research in an AI chatbot more often than with Google, and 69% chose a different vendor than planned based on the chatbot’s guidance. (G2, The Answer Economy, March 2026)
Accountability moved at the same time. The 2026 B2BMX Insights Benchmark Survey found revenue-based quotas rose from 25.3% in 2025 to 33.3% in 2026, and that pipeline influenced has overtaken opportunities generated and MQLs as the metric B2B teams are most often measured on, at 44% of respondents.
Put those four facts together and you get the constraint of 2026: a flat budget, a mostly unready AI line item, a discovery layer that has moved, and a quota that no longer forgives activity metrics.
The 95/5 reality: who your budget is actually talking to
In-market buyers are the small share of a category actively researching a purchase right now, and in B2B that share is far smaller than most budgets assume.
The number comes from the LinkedIn B2B Institute’s 95-5 rule. Marketing Week reported on the Ehrenberg-Bass study for the Institute: businesses change providers of services like banking, legal advice, software and telecoms roughly every five years, so only about 20% are in market in a given year and about 5% in a given quarter. The Institute advises advertising mostly to buyers unlikely to buy today, because advertising builds memory links to category entry points rather than moving people into a funnel.
Only about 5% of a category’s buyers are in market in any given quarter, and only about 20% in a given year. (Ehrenberg-Bass study for the LinkedIn B2B Institute, reported by Marketing Week)
The researchers add one caveat: the 95% figure is not precise for every sector, so treat it as a planning bias rather than a constant.
The belief that marketing works like a funnel is expensive. In a LinkedIn study of B2B marketers, 96% expected the main effect of their ad campaigns within two weeks, and the Institute calls that belief a myth.
The 2026 buyer data agrees with the researchers rather than the marketers. TrustRadius’s 2026 B2B Buying Disconnect Report (1,862 buyers, 444 vendors) found 79% of buyers had already heard of the product before research started, 83% shortlisted three products or fewer (average 2.7), and 67% bought their first choice.
So most of your budget talks to people who are not shopping yet, and most pipeline comes from a buyer who already knew you existed. A b2b demand generation strategy has to decide which job each dollar does. That is the demand creation vs demand capture split.
The five gates of a b2b demand generation strategy
The five gates are sequential on purpose. Each one constrains the next, and you don’t get to open a gate you haven’t passed.
Gate 1: segment pick one buyer you could win
A segment is a named group of buyers with a shared trigger event, a known buying group, and a reason to believe you can beat the incumbent.
The trigger matters more than the industry. TrustRadius found 53% of buyers spoke to a peer during their purchase and every one found it helpful, while 74% consulted customer reviews. Those people do your qualification work, and they only show up if you know where to look.
Buying groups now average nine members and cycles have compressed to seven months (INFUSE and G2 study), so a segment you can’t name people for isn’t a segment. Work out who sits at that table with buyer committee mapping.
Exit test: you can name the trigger event, the buying group, and the proof that buyer needs.
Gate 2: position write the one claim you can defend
Positioning is the sentence your buyer repeats to their boss when someone asks why your vendor.
If a competitor can say the same sentence, you have a tagline, not a position. TrustRadius found 47% of buyers trust online resources less than a year ago, and vendor marketing collateral ranked last among the resources buyers consult.
CMI’s 2026 B2B Content and Marketing Trends survey (1,015 marketers) puts content relevance and quality as the top driver of effectiveness at 65%, ahead of team skills at 53% and sales alignment at 45%. Relevance is a positioning outcome.
Exit test: sales can repeat your claim without wincing, and you can name the third-party evidence a skeptical buyer would find.
Gate 3: portfolio decide where the money goes, then cap it
A channel portfolio is a set of channels, each with one job, one owner and one metric, small enough that every one gets attention.
The cap is what makes it a portfolio. Gartner found awareness and conversion now take 62.6% of total media spend, up ten-plus points since 2024, while loyalty and retention spending fell 29% to under 15%. Directive’s 2026 guide, drawing on Gartner’s 2025 data, puts digital at 61.1% of marketing spend and paid media at 30.6% of budget.
That is capture-heavy by default, which is fine as long as it is a decision rather than a drift.
Exit test: every live channel has one job, one owner, one metric, and there are no more than four.
Gate 4: offer decide what the buyer takes next
An offer is the specific next step a buyer can take without a salesperson in the room, at each stage of the demand generation funnel.
Two things force this in 2026. Gartner’s sales survey of nearly 650 B2B buyers, reported in March 2026, found 67% prefer a rep-free experience and 45% used AI during a recent purchase. Buyers also verify: 94% of the TrustRadius study’s buyers fact-check AI answers at least some of the time.
Exit test: for every stage, a buyer can progress without a rep, and the thing they take next tells you something.
Gate 5: measurement decide what counts as proof, before you spend
A measurement strategy is a locked definition of one metric, plus the supporting metrics that explain it, agreed before the budget is committed.
Definitions written after the results arrive are not definitions. B2BMX’s 2026 benchmark data is unambiguous: pipeline influenced is now the leading performance metric at 44%, overtaking opportunities generated and MQLs, while revenue-based quotas rose to 33.3%. And 41.7% of organizations now run brand and demand teams on shared campaigns, up from 29.3%.
Exit test: you can define pipeline influenced in one sentence finance would accept, and you can produce it monthly.
The demand generation budget: a decision table for create, capture, and convert
Split your program budget three ways, assign one job to each, and revisit the split when the evidence changes rather than when a channel asks for more money.
The table below is the framework I use with mid-market and enterprise teams. The starting split is my recommendation, not a survey result.
| Motion | Buys | Split | 2026 condition | Metric | Kill it when |
|---|---|---|---|---|---|
| Create | Brand, POV, category education, community | 30–40% | 84% sit in Gartner’s brand doom loop | In-market reach, branded search, shortlist | Two quarters with no branded-search movement |
| Capture | SEO, AI-answer visibility, paid search, comparison | 35–45% | Awareness and conversion take 62.6% of media spend | Qualified pipeline by channel | Cost per qualified opportunity climbs |
| Convert | Pricing pages, self-serve trials, scheduling, routing | 15–25% | 67% prefer a rep-free experience; ChatGPT referrals up 303% | Stage conversion, time to first meeting | Stage conversion drops and sales blames lead quality |
Gartner’s figures describe media spend, not total budget, so don’t read 62.6% as a create-versus-capture ratio. A create budget of 30–40% looks reckless until you remember Gartner also found companies with a strong brand strategy are twice as likely to exceed growth goals. The brand doom loop cuts both ways: defund brand and you lose the compounding, fund it carelessly and you can’t defend it.
Budget allocation across those three motions is the one decision a b2b marketing strategy 2026 cannot outsource to a channel team. The 2026 demand channel mix snapshot has the line-by-line reallocation map. The point here is narrower: make the split explicit, then defend it.
Which demand generation metrics actually matter
Report pipeline influenced with a written definition, cost per qualified opportunity by channel family, and one leading indicator of in-market engagement. Everything else is diagnostic.
| Metric | Proves | 2026 read | Verdict |
|---|---|---|---|
| Pipeline influenced | Marketing’s contribution to revenue | Top metric, 44% | Report it, definition locked in writing |
| Revenue quota attainment | Whether marketing carries a revenue number | 33.3%, up from 25.3% | Expect the ask; answer with pipeline |
| Cost per qualified opportunity | Efficiency of a channel family | No clean 2026 B2B benchmark | Compare your own channels only |
| In-market account engagement | Whether signal and content land on buyers | Signal-aligned programs drove 93% more engagement | Strongest leading indicator available |
| AI citation and referral share | Whether you’re found in the new discovery layer | ChatGPT referrals to tracked B2B sites up 303% | Track monthly |
| MQL volume | How many people filled in a form | No longer the leading metric | Stop reporting it upward |
The measurement problem is mostly a definition problem. CMI’s 2026 research found 33% of B2B marketers call measuring content effectiveness a top challenge, and only 12% rate their marketing highly effective. TrustRadius sharpened the gap: 16% of buyers are not tracking AI ROI at all, while vendors estimate just 3%.
That gap is where budget gets cut. If your dashboard can’t answer “what did this spend return” in a sentence a CFO accepts, you have an activity report, not a measurement system. These are the metric definitions that hold up.
A 12-month roadmap, sequenced
Run the five gates across four quarters in order, and refuse to start a gate until the previous one has an exit test passed. The sequencing is the strategy.
- Month 1 Segment. Pick one segment and write down its trigger event, buying group and required proof. Kill programs that serve a different one.
- Month 2 Position. Write the claim a competitor cannot copy, and collect the third-party evidence behind it. Re-test it against five buyer conversations.
- Month 3 Portfolio audit. Map every dollar and hour against create, capture and convert. Publish a kill list. Cap live channels at four.
- Months 4–5 Offer and conversion. Fix pricing visibility, one landing path per stage, scheduling and routing. Every stage gets a rep-free next step.
- Months 6–7 Capture hardening. Pick the capture channel with the best cost per qualified opportunity and make it excellent. Add AI-citation tracking.
- Months 8–9 Create compounding. Fund the create bucket: point of view, one owned channel, a few field programs. The 2026 B2BMX benchmark found in-person events claimed the top slot for pipeline investment, displacing the digital channels that led the 2025 plan.
- Month 10 Measurement rebuild. Lock the pipeline-influenced definition with finance. Rebuild the dashboard around the five metrics above. Retire MQL volume from the board report.
- Months 11–12 Rebalance and repeat. Reallocate against evidence, not requests. Then start the cycle again on the next segment.
If you want a diagnostic version rather than a plan, run the 90-day demand generation audit first. For the steady-state operating model behind these gates, read the B2B demand generation operating system.
Failure modes
- Buying tactics before passing the gates. A new channel is a good way to avoid deciding who you are for.
- Treating create as awareness. Brand spend with no measurement mechanism gets cut in the next reforecast, and Gartner’s brand doom loop is 84% of the market already behaving that way.
- Funding capture with creation money. You end up with rising cost per click and no memory structures when the 5% finally show up.
- Running eight channels at 40% capacity. Four at 90% will always beat eight at 40%.
- Keeping MQLs as the headline metric. Revenue-based quotas rose to 33.3%, and a lead-count argument does not survive that meeting.
- Treating AI visibility as a content project. It is a capture channel with its own metric, and referral share is measurable.
- Measuring with last click only. You will credit the chatbot and blame the article.
- Asking for a two-month ROI window. The two-week expectation belongs to the 96% of marketers the B2B Institute describes, not to your finance team.
FAQ
What is a B2B demand generation strategy?
A b2b demand generation strategy is the set of decisions that determines where demand comes from and how it becomes pipeline: which buyer you target, what you say, which channels get money, and how you prove it worked. It is a plan for cause and effect.
How do you build a demand generation strategy that produces predictable pipeline?
Pass the five gates in order: segment, position, portfolio, offer, measurement. Predictability comes from the order, because each gate removes a source of variance the next one would otherwise inherit.
Segment narrows the audience, position narrows the message, the portfolio caps your channel count, and measurement fixes the definition of success before money moves. Teams that skip to tactics get activity they can’t forecast.
What is the difference between demand generation and lead generation?
Demand creation introduces a problem, a category or a point of view to buyers not actively shopping, while demand capture meets buyers who already have intent. Lead generation is a narrower mechanism inside capture: it collects contact details.
Most teams confuse the two because capture is easier to attribute. The demand generation vs lead generation comparison breaks it down.
How much should a company spend on demand generation?
Start from a share of revenue, then adjust for stage. Directive’s 2026 benchmarks put startups at 15% to 30%+ of revenue, early-growth companies under $10M ARR at 10% to 20%, mid-market at 7% to 12%, enterprise at 5% to 8%, and mature businesses at 4% to 7%.
Gartner’s 2026 CMO Spend Survey puts the average across 401 CMOs at 7.8% of revenue. Use those as floors and work backwards from the pipeline you need.
Which demand generation metrics actually matter?
Pipeline influenced, with a written definition finance accepts, is the headline. Cost per qualified opportunity by channel family tells you where to put next quarter’s money.
In-market account engagement is your leading indicator, and AI citation and referral share tells you whether you are visible where buyers now start. MQL volume is a diagnostic, not the number to take into a budget conversation.
How long does demand generation take to show results?
Expect leading indicators within a quarter and pipeline within two to four quarters for most motions. The 2026 data sets the floor: buying groups average nine members, buying cycles have compressed to seven months, and 79% of buyers already know the brand before research starts.
Expect demand generation to take longer than two weeks: the B2B Institute found 96% of B2B marketers expect ad impact within two weeks and calls that a myth.
What is the best demand generation framework for a small team?
The same five gates at smaller scale, with a harder cap: one segment, one claim, one capture channel, one conversion path, one metric. Small teams lose money covering all three budget motions at once, so put roughly half the budget into the capture motion that already produces qualified pipeline.
CMI’s 2026 data found sales alignment still a challenge for 45% of B2B marketers, so spend scarce time on the shared definition of qualified rather than on more channels.
What to do next
- Write your segment: trigger event, buying group, required proof. One page.
- Publish the create/capture/convert split and the kill list next to it. Both go to your CFO.
- Lock the pipeline-influenced definition with finance before the budget cycle, not after.
- Run the five-gate review once, so you know which gate you are stuck on.
That is the entire strategy. Everything after it is execution, and execution is finally the cheap part.
Sources & references
- Gartner 2026 CMO Spend Survey Finds CMOs Allocate 15.3% of Marketing Budgets to AI, But Only 30% Are Ready to Scale AI CapabilitiesGartner · Accessed Oct 10, 2026Gartner, 2026
- Gartner Marketing Survey Finds Awareness and Conversion Account for 62.6% of Total Media SpendGartner · Accessed Oct 10, 2026Gartner, 2026
- Gartner Marketing Survey Finds 84% of Companies Are Stuck in a Brand Doom LoopGartner · Accessed Oct 10, 2026Gartner, 2026
- New G2 Research: Half of B2B Software Buyers Now Start Their Research With AI Chatbots (The Answer Economy)G2 · Accessed Oct 10, 2026G2, 2026
- B2B Marketers Face Growing Pressure to Prove ROI as Revenue-Based Quotas RiseB2BMX Insights · Accessed Oct 10, 2026B2BMX Insights, 2026
- Just Released: The 2026 B2BMX Insights 2026 Benchmark Survey ResultsB2BMX Insights · Accessed Oct 10, 2026B2BMX Insights, 2026
- 2026 Account Based Marketing (ABM) Benchmark Survey Findings: ABM Moves Beyond Pilot Stage, With AI Powering Smarter ExecutionB2BMX Insights · Accessed Oct 10, 2026B2BMX Insights, 2026
- TrustRadius 2026 B2B Buying Disconnect Report Reveals AI Has Changed How Buyers Research, But Not What They TrustHG Insights / TrustRadius · Accessed Oct 10, 2026HG Insights / TrustRadius, 2026
- Trust More, Verify Everything: What the 2026 B2B Buying Disconnect Report Says About Where Buying Is Actually HeadingHG Insights · Accessed Oct 10, 2026HG Insights, 2026
- Study Finds Demand Programs Aligned with Buyer Signals Deliver 93% More EngagementDemand Gen Report / B2BMX Insights · Accessed Oct 10, 2026Demand Gen Report, 2026
- Demandbase: ChatGPT Referrals to B2B Websites Nearly Quadrupled in a YearDemand Gen Report / B2BMX Insights · Accessed Oct 10, 2026Demand Gen Report, 2026
- Gartner: 67% of B2B Buyers Prefer a Rep-Free ExperienceDemand Gen Report / B2BMX Insights · Accessed Oct 10, 2026Demand Gen Report, 2026
- 9 Takeaways and Insights From the 2026 B2B Content and Marketing Trends ReportContent Marketing Institute / MarketingProfs · Accessed Oct 10, 2026CMI / MarketingProfs, 2026
- 95-5 Rule | LinkedIn Marketing Solutions (LinkedIn B2B Institute)LinkedIn · Accessed Oct 10, 2026LinkedIn
- Ehrenberg-Bass: 95% of B2B buyers are not in the market for your productsMarketing Week · Accessed Oct 10, 2026Marketing Week, 2021