

Most pipeline reviews are status theater: reps narrate deals, managers guess, and the forecast number is whatever felt best in the room. The stakes are higher than the vibes suggest — the average B2B win rate is 21%, and only 27% of reps consistently hit quota (HubSpot, updated February 24, 2026). Teams that review the pipeline weekly catch conversion decay while it is still fixable; teams that wait for the monthly forecast scrub find out late. This agenda is the operating version of that discipline: a 45–60 minute meeting that separates create, capture, and convert health, compares each against verified benchmarks, and ends with a logged decision for every item. It assumes you have a cadence to plug into — if you do not, install it first via the pipeline review operating cadence playbook.
Purpose & attendees
The review exists to make decisions about pipeline health, not to update leadership. Three roles must be present; everyone else is optional and rotates:
| Role | Why they must be there |
|---|---|
| Sales leader | Owns the forecast number and forecast-category moves — the only person who can lock it |
| RevOps lead | Owns the data, the pre-read, and the decisions log; holds the meeting |
| Marketing/demand lead | Owns create and capture blocks; can pause or shift spend only here, not in the meeting’s hallway |
Add finance monthly, and rotate one AE or SDR per week so reps hear how the room treats their deals. Keep the room small — this is a working session, not a town hall. If someone has nothing to decide, they read the log afterwards.
Pre-read requirements
Every number on screen must have been delivered the morning before, in one document, by RevOps. The rule: no one presents a chart they did not pre-read — if the room is discovering the data live, the meeting is doing pre-read work. The pre-read contains exactly:
- Stage funnel counts and value — current and prior 4 weeks, by stage and by rep.
- Stage conversion table — % moving stage-to-stage over a 4-week rolling window, vs. your 4-week baseline.
- Coverage ratio — total pipeline value ÷ remaining target, by segment and by rep.
- Capture metrics — MQL→SQL conversion, median time-to-touch, SDR acceptance rate, and rejection reasons by category.
- Exceptions list — routing failures, SLA breaches, data-quality issues, and automation failures, each with an owner.
- At-risk deals — AI-flagged or manually flagged deals, with the signal that flagged them.
- Channel notes — new qualified opportunities by source, and what changed in spend.
- Last week’s decisions log — opened the meeting, not closed it.
Gong’s guidance is blunt on this: analytics from conversation intelligence should answer “who are you talking to, what’s the next step, will they sign” before anyone walks into the room — the meeting is for strategy, not discovery (Gong, last modified March 4, 2026).
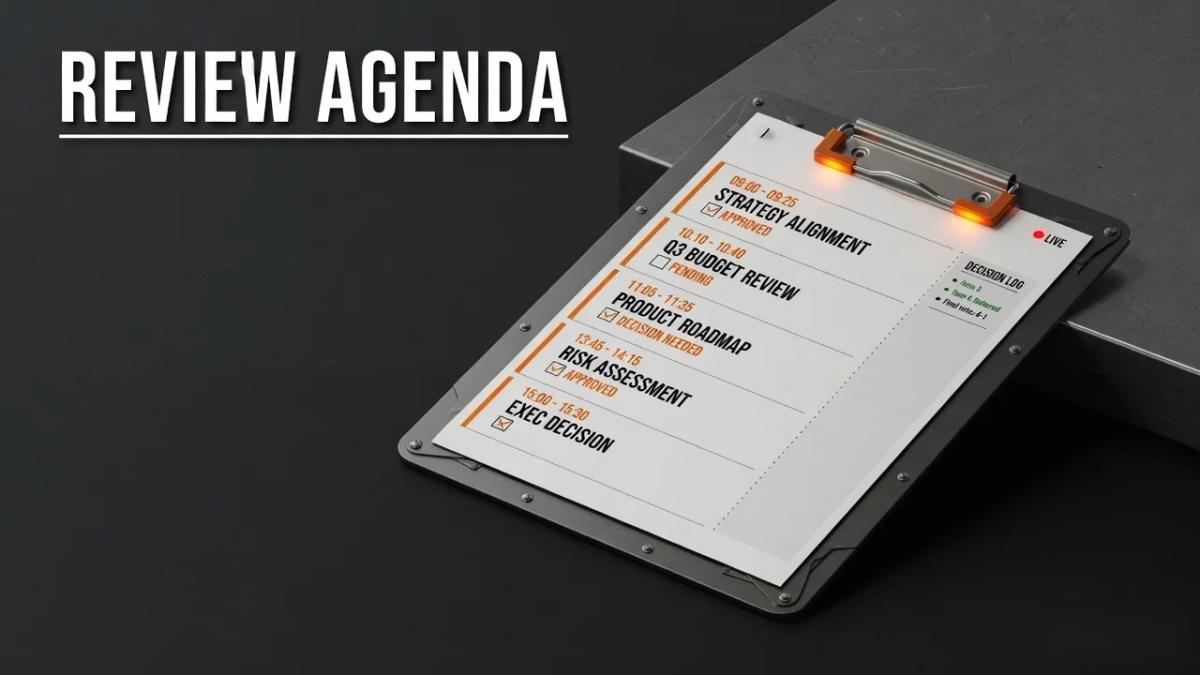
The 45–60 minute agenda
| # | Block | Minutes | Presents | Decision |
|---|---|---|---|---|
| 1 | Pipeline & stage conversion snapshot | 10 | RevOps | Which stage to intervene on this week |
| 2 | Capture efficiency | 8 | Marketing/demand | Fix or kill a capture source; SLA breach response |
| 3 | Create & distribution signals | 8 | Marketing/demand | Accelerate, hold, or pause a channel |
| 4 | Ops/SLA exceptions | 7 | RevOps | Root cause and owner for each exception |
| 5 | Forecast & coverage check | 10 | Sales leader | Locked forecast number; coverage gap action |
| 6 | Decisions log | 5 | RevOps | Every item exits with owner + date |
If blocks 1–4 routinely run over, the pre-read is weak — not the agenda.
1. Pipeline & stage conversion snapshot (10 min)
What to discuss: stage counts against plan, conversion deltas vs. your 4-week baseline, and where deals are dying on repeat. A single conversion dip at one stage is usually the same problem repeating weekly — find it before it becomes a quarter problem.
Metric to look at: stage conversion rates per stage (4-week window) and total pipeline value by stage.
Presents: RevOps.
Healthy signal — benchmark table (compare, don’t copy):
| Metric | Benchmark | Source |
|---|---|---|
| Overall win rate | 21% average; high performers sustain 25–30%+ | HubSpot (updated Feb 24, 2026); Gain.io (Mar 31, 2026) |
| Close rate | 29% average | HubSpot |
| MQL→SQL conversion | 30–45% healthy band; 13–25% dysfunctional | LoudDemand 2026 leak-pattern research |
| Quota attainment | Only 27% of reps consistently hit quota | HubSpot 2026 Sales Trends |
| Rep concentration | Top 10% of reps drive 65% of all revenue | Clari Labs, 2025 (10M opportunities, 121 enterprises) |
| Buying group size | 5 decision-makers involved in an average sale | HubSpot |
A healthy review shows win rate stable within ±2 points over four weeks, every stage converting within its band, and no stage below baseline two weeks running.
2. Capture efficiency (8 min)
What to discuss: whether leads that should be pipeline actually become pipeline. This is the leak block: response latency, definitional drift, and AI-channel signals.
Metrics to look at: MQL→SQL conversion, median time-to-touch (T2T) by source, SDR acceptance rate, rejection reasons by category.
Presents: marketing lead; SDR manager confirms.
Healthy signal — verified baselines:
- Median B2B first-response time is ~42 hours and 38% of inbound leads never hear back; responding within 5 minutes makes you 100x more likely to connect — speed is the cheapest pipeline lever you own (Chili Piper, August 1, 2025).
- SDR acceptance rate below 50% means the MQL definition is contested, not the reps — fix the definition, not the people (LoudDemand 2026 research).
- The buyer arrived pre-informed: 94% of business buyers used AI in their purchase process in 2026, up from 89% in 2025, and AI-driven vendor discovery is up 250% since early 2024 (Forrester, January 22, 2026; Gong Labs, July 29, 2026). Track “found us via AI” disclosures in discovery notes — if capture can’t source them, you are flying blind in the fastest-growing channel.
3. Create & distribution signals (8 min)
What to discuss: whether new qualified pipeline is being created at the rate the plan demands — before it becomes a coverage problem two quarters out.
Metrics to look at: new qualified opportunities vs. plan by source, channel spend changes, and what moved attention (AI visibility, content, outbound).
Presents: marketing/demand lead.
Healthy signal — verified baselines:
- 72% of company revenue comes from existing customers and 28% from new ones (HubSpot) — if new-pipeline creation is entirely dependent on one source, the plan is fragile; expect source mix to move weekly without the total dropping.
- 68% of sales professionals report lead quality improved, and 52% saw more buyers using self-serve tools (HubSpot 2026) — volume targets that ignore quality will flood capture and tank MQL→SQL.
- If a channel’s pipeline “converts” but never moves stages, it is attention, not demand — the structured way to run this block is the 90-day demand generation audit.
Healthy signal: creation tracking to plan for 3 of the last 4 weeks, no single source driving >40% of new qualified pipeline without a deliberate reason, and every program paused this quarter has a named re-entry date.
4. Ops/SLA exceptions (7 min)
What to discuss: routing failures, duplicates, response-time SLA breaches, and data quality — the mechanical leaks that quietly kill conversion. Nothing in this block is a personality issue.
Metrics to look at: SLA adherence (T2T per source, time-to-disqualify), named-account collision rate, duplicate rate, closed/lost reason completeness.
Presents: RevOps.
Healthy signal — verified baselines:
- 98% of companies fail to track closed/lost reasons consistently, and only 25% of sellers complete assigned sales tasks (Clari Labs, 2025) — both are the cheapest fixes most teams have, and both belong in this block weekly.
- Named-account collision rates above ~5% mean routing logic is broken (LoudDemand 2026 research) — the fix is a routing rewrite, not a meeting about reps.
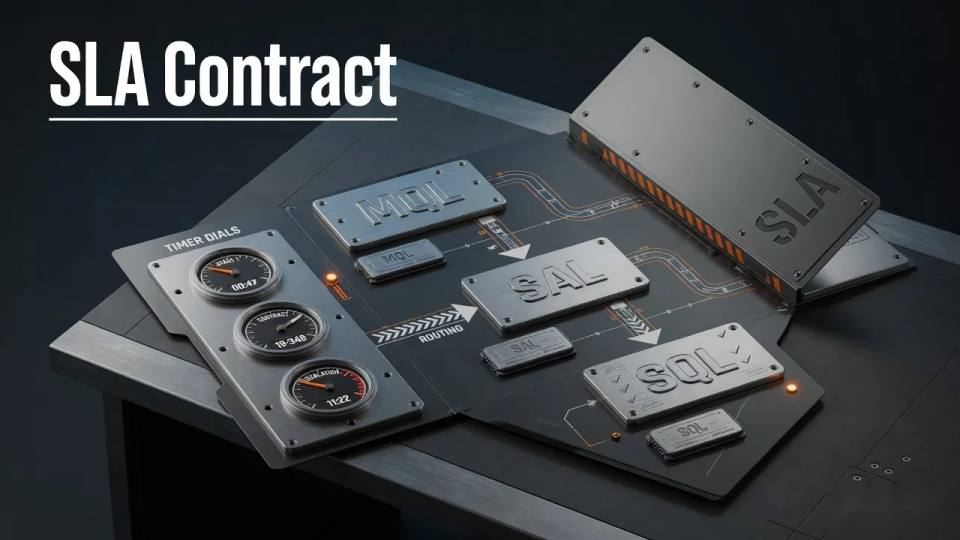
- SLA definitions and escalation rules live in the sales-marketing SLA setup playbook; this block only audits adherence to what is already signed.
Healthy signal: every exception exits with a root cause and an owner; the same exception does not appear two weeks running; closed/lost reason completeness trending to 100%.
5. Forecast & coverage check (10 min)
What to discuss: the forecast number and the pipeline behind it. The sales leader locks the number; the room pressure-tests it with signals instead of gut feel.
Metrics to look at: coverage ratio vs. plan, forecast categories vs. historical stage probabilities, at-risk flags, email velocity on committed deals.
Presents: sales leader; RevOps validates.
Healthy signal — verified baselines:
- 3x pipeline coverage is the common benchmark (range ~2.5–4x by cycle length); teams with strong coverage show up to 28% higher sales performance (Gain.io, March 31, 2026). Check it weekly — a shortfall in month two is a revenue shortfall in month five.
- Teams that update forecasts weekly see up to 10–15% accuracy improvement, and ~70% of high performers blend weighted, historical, and stage-based methods (Gain.io). Defined pipeline stages alone deliver up to 25% better forecast accuracy; dirty data cuts accuracy by over 20% (Gain.io).
- Email velocity is Gong Labs’ strongest closing signal: closed-won deals run ~8 emails per week vs. under 2 in lost deals (339% gap), and prospect-originated emails widen it to 531% — in the final week, 753% (Gong Labs, last modified March 4, 2026). A “committed” deal with collapsing email velocity is a risk flag, not a story.
- Nine in ten sales teams already use AI agents or expect to within two years (Salesforce State of Sales, 2026) — AI-assisted deal inspection is now the pre-read, and AI-assisted sellers close new logo deals 20% faster than two years ago (Clari Labs, 2025).
Healthy signal: forecast within ~10% of actual for the last two months, coverage at or above 3x (or a documented reason it isn’t), and every at-risk flag discussed in the room, not overruled silently.
6. Decisions log (5 min)
What to discuss: nothing new. Read last week’s log, confirm closures, and log this week’s decisions. If an item appears twice, either the owner is broken or the decision was — both are visible to the whole room, which is the point.
Presents: RevOps.
Healthy signal: every decision has an owner and a date; the log is the first thing read next week; nothing survives three weeks unclosed.
Decision log fields
| Field | Requirement |
|---|---|
| Date | Meeting date the decision was made |
| Decision | One sentence, written as an action, not a sentiment |
| Owner | One named person, not a team |
| Due date | When it lands; overdue items open next week’s meeting |
| Metric protected | Which number this decision defends (stage conversion, coverage, SLA, forecast) |
| Status | Open / Done / Overturned — overturned decisions are logged too |
Meeting hygiene
- No status theater. Reps do not rattle off deal lists; each rep brings their single most pressing deal and the room collaborates (Gong, last modified March 4, 2026). History is a pre-read; momentum is the agenda.
- No blame. The review inspects systems and signals, not people. A rep’s bad week is a coaching item in the hallway, not a public artifact.
- Evidence over vibes. Gong’s rule: focus on results, not stories, and let analytics answer the “will they sign” question before the meeting (Gong, 2026). If a claim has no number behind it, it goes to the log as an investigation.
- Laptops closed, phones down. This is team strategy, not a status round (Gong, 2026). If you will not enforce that, do not start this cadence.
- Small room, hard start. 45 minutes is the budget; the pre-read protects it. When a block runs over, the fix is a better pre-read, not a longer meeting.
Citations
Sources & references
- State of Sales ReportSalesforce