

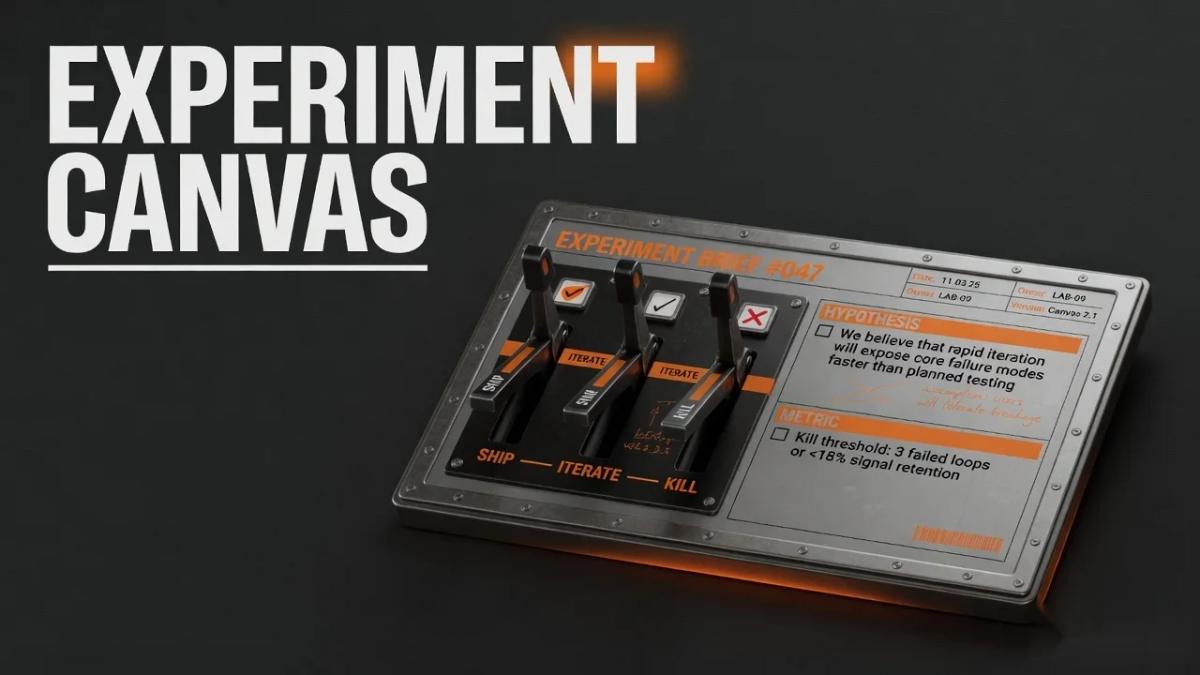
Most demand “experiments” never produce a decision. The test ships, the dashboard goes green, someone screenshots the lift, and the variant quietly goes live — or the test runs six weeks, everyone loses interest, and the result is never read. The numbers explain why: only about 1 in 7 A/B tests produces a statistically significant improvement (Wingify’s platform data on CTA tests, cited by CXL), and most winning tests deliver small gains in the 1–8% range, not the 30% screenshots imply. Worse, most tests are underpowered or peeked at, so even the “winners” regress: in a 1,000-test A/A simulation, 771 tests reached 90% significance at some point simply because someone kept looking (CXL). The fix is boring and cheap: write the decision rules before the test ships. This canvas forces that.
The Rule
No experiment ships without decision rules written first.
Not “we’ll see what the data says.” A written, threshold-based rule: ship if X, iterate if Y, kill if Z. Eppo’s Drew Harry makes the case bluntly in Make Decisions Before Experimenting (January 2025): decide what each possible result means before you see it, with the actual decision-maker in the room, or your team will rationalize ambiguous results after the fact. The canvas below is the pre-registration.
The canvas — ten fields
Copy this into a doc. Every field gets filled before the experiment ships. If a field is empty, the experiment doesn’t ship.
1. Hypothesis — if X, then Y, because Z
One sentence, falsifiable, with the mechanism stated. The mechanism (“because”) is what survives a null result — you learn whether your customer theory was wrong even when the change fails.
- Bad: “We should try a shorter form.” (No direction, no mechanism, no falsifiability.)
- Good: “If we cut the demo-request form from 9 fields to 4 for mid-market visitors, then form completion will rise from 5% to at least 6%, because each removed field removes a friction point buyers cite in our call notes.”
Statsig’s Paul Morrill (What’s the point of hypothesizing?, July 2026) publishes a practitioner template worth stealing wholesale:
We believe that [change], for [target users], will [direction] the [success metric] from a baseline of X% to at least Y%, based on [data / rational insight]. We will measure this effect over [timeframe], with an MDE of Z%, and monitor [guardrail metric(s)] to ensure no harm or downside risk.
2. Primary metric — exactly one, not the vanity one
One metric decides the test. It must be the business outcome the change is supposed to move, measurable per exposed visitor, and sensitive enough to move inside your runtime.
Vanity traps in B2B: form views, CTA clicks, page sessions. Those are inputs. The primary metric is the conversion that feeds pipeline — demo requests, qualified signups, or MQLs with fit score. Clicks on a “Request demo” button are a leading indicator, not the decision. If you can’t name the pipeline consequence of the metric, you haven’t named a primary metric. Our pipeline metrics that matter guide covers how downstream these decisions actually land.
3. Guardrail metrics — what must not break
The metrics you monitor to make sure the win isn’t a trap. Eppo’s definition: guardrail metrics answer “what results would be bad enough that we end an experiment early?” (Make Decisions Before Experimenting).
B2B examples:
- Demo request → demo-to-meeting conversion (more, lower-quality requests is not a win)
- Form completion → lead-to-MQL fit rate and sales call no-show rate
- Landing page changes → bounce rate on the page and downstream trial activation
- Pricing/content tests → support ticket volume and unsubscribe or churn proxies
- Checkout-like flows → cart abandonment (Baymard’s tracked average is 70.19% and shows the average site has 32 checkout improvements worth a combined ~35% conversion gain (Baymard)) — one of the better guardrail benchmarks that exist
Write the guardrail threshold in the decision rules (e.g., “kill if demo-to-meeting drops more than 10% relative”), not in a vague ‘watch this.’
4. Audience & traffic source — with a sample-size reality check
Who exactly is exposed, and where do they come from? A test on 3,000 visitors from a webinar blast is a test of webinar traffic, not your website. State the segment (ICP fit, firmographic, intent tier), the traffic source (organic, paid, email, AI-referral), and the device split.
Then run the sample math before shipping. The inputs: baseline conversion rate of the exposed surface (trailing 4–8 weeks, not your company-wide number), your minimum detectable effect (MDE), 95% significance (α=0.05), and 80% power (β=0.20). Optimizely’s guidance uses exactly these defaults — baseline 5%, MDE 10% — and warns that underpowered tests produce improvements that “are unlikely to hold up when you implement your variation” (Optimizely). CXL’s practical floor: aim for roughly 350–400 conversions per variation, and don’t trust any result below that (CXL).
5. Single change under test
One variable. Not a redesign, not “a few tweaks.” If the variation differs from control in three ways and it wins, you learned nothing about which change mattered. CXL’s reminder on scope: the more variants you test, the higher the false-positive rate — with 41 variants at 95% confidence, the chance of a false positive is 88% (CXL). One change, one hypothesis, two versions.
6. Minimum runtime / sample — the honest math
This field contains the calculator output, not a hope. Three verified anchors:
- Significance and power. 95% significance / 80% power remains the industry standard; Evan Miller’s sample-size rule of thumb is n = 16σ²/δ² per variation (Evan Miller). For a 5% baseline and a 20% relative MDE, that’s roughly 7,600 visitors per variation.
- Time. Run at least two full business cycles (2–4 weeks) so weekday, week-of-month, and campaign effects wash out. CXL calls 2 weeks the minimum, 4 the comfortable default (CXL); Optimizely and VWO both set the floor at 7 days to capture weekday/weekend variation (Optimizely, VWO).
- No peeking. If you stop tests when the dashboard looks good, the statistics lie: peeking after every observation turns a nominal 5% false-positive rate into 26.1%, and peeking 10 times means what looks like 1% significance is really 5% (Evan Miller). Either fix the sample size and don’t look, or use a sequential/Bayesian engine (Optimizely’s Stats Engine, VWO’s SmartStats) that adjusts for peeking.
If the calculator says your test needs more than ~6 weeks, you have a design problem, not a patience problem. Raise the MDE, narrow the audience, or pick a higher-traffic surface.
7. Ship / iterate / kill rules — concrete thresholds
Written before launch, agreed by the decision-maker, threshold-based. A working B2B pattern:
- Ship if the primary metric is significant at p < 0.05 (95% confidence) and the observed lift ≥ your MDE and no guardrail breached its threshold.
- Iterate if the direction is promising but the effect is below MDE (p < 0.05, lift < MDE), or a guardrail shows tension — record what to change, and run a follow-up. This is where most real gains live: CXL’s experience is that most first tests fail and that winning tests typically return 1–8% — a 5% monthly lift compounds to roughly 80% over 12 months (CXL).
- Kill if at the planned sample size the result is not significant (e.g., p > 0.20 — no signal, not “almost a win”), or if a guardrail breach exceeds its threshold. Killing is a valid outcome; shipping a null result because the team “likes the change” is how sites regress.
One rule that survives everything: the decision is committed before exposure. Pre-registration is what makes the readout a meeting of five minutes instead of an hour of motivated interpretation.
8. Owner & review date
A named human accountable for launch, readout, and follow-up — plus the date the decision gets made, scheduled on a calendar. Un-owned resources become shelfware; un-scheduled readouts become quarter-end archaeology. The review date is a commitment that the test ends and produces a written decision — ship, iterate, or kill — on a specific day.
9. Risk & novelty check
Two questions before launch:
- Novelty: Does the variation’s appeal depend on being new? New variations get attention just for being different; the lift decays. Plan for at least ~2× the minimum runtime on surfaces with returning visitors, and check new vs. returning segments at readout.
- Risk: What breaks if the change is wrong? (Wrong tracking, broken layout on a browser, mispriced offer, sales receiving junk leads.) List the harm, the detection mechanism, and the rollback. If the rollback is harder than the launch, don’t launch.
10. Learnings capture — what to record after
At readout, write these five things down in a place the team actually reads:
- The decision (ship / iterate / kill) and the numbers that drove it.
- Whether the hypothesis mechanism was confirmed or refuted — this is the reusable knowledge.
- Segments where results differed (device, source, firmographic) — even a null test often has a segment story.
- What you’d change in the follow-up test.
- The failure modes you hit (peeking, tracking bugs, SRM), so they don’t recur.
VWO’s own 2026 interview series keeps landing on the same point — “Even failed tests should make organizations smarter. Else, it’s all noise” (VWO).
Sample filled canvas
Illustrative example — numbers are made up for demonstration, not real results.
| Field | Filled value |
|---|---|
| Hypothesis | If we change the pricing-page CTA from “Request demo” to “See pricing” for mid-market visitors (200–2,000 employees), then demo requests per visitor will rise from 5.0% to at least 6.0%, because self-serve evaluators are pre-qualified and want pricing before a sales conversation. |
| Primary metric | Demo requests per visitor on the pricing page (form submit), measured 4–8 weeks baseline before launch. |
| Guardrails | Demo-to-meeting conversion (kill if −10% relative); bounce rate on pricing page (flag if +15%); trial activation after demo (flag if −5%); support tickets mentioning pricing (flag if +20%). |
| Audience & traffic | Mid-market segment (firmographic filter), organic + paid search traffic only, desktop and mobile split recorded; ≈10,000 exposed visitors/month. |
| Single change | CTA button label + microcopy only. Nothing else. |
| Minimum runtime / sample | Baseline 5%, MDE 20% relative, 95% significance, 80% power → ≈7,600 per variation (n = 16σ²/δ²); at 5,000 per variation/month ≈ 6 weeks, min 2 full business cycles, no peeking (sequential engine if dashboard peeks are unavoidable). |
| Ship / iterate / kill | Ship if p < 0.05, lift ≥ 20% relative, guardrails within thresholds. Iterate if p < 0.05 with lift < MDE or guardrail tension — next test: shorten the form. Kill if p > 0.20 at planned sample or any guardrail breach. |
| Owner & review date | Owner: Demand Ops lead. Review date: set at launch, on calendar. |
| Risk & novelty | Risk: routing more demo requests than SDRs can follow up — check routing SLA before launch; rollback = revert CTA. Novelty: check new vs. returning visitor segments at readout; run 2× minimum on returning visitors. |
| Learnings | To be recorded at readout: decision, mechanism verdict, segment deltas, follow-up test, failure modes. |
2026 note: AI speeds up hypotheses, not decisions
The 2026 tooling now drafts and critiques hypotheses for you — Statsig’s Hypothesis Advisor auto-flags missing fields like MDE and guardrails (Statsig), VWO’s Wandz AI layer wraps its testing engine (VWO), and Optimizely ships agentic experimentation workflows. That’s genuinely useful: an LLM can generate 20 candidate briefs in an afternoon. It does not change this canvas. A machine-generated hypothesis with no decision rule is still a launch with a dashboard — and the new failure mode is an agent shipping variations with no peeking protection at all. Keep the gate: decision rules written first, human owner named, thresholds committed before exposure.
Citations
Sources & references
- How Not To Run an A/B TestEvan Miller
- How Long to Run an ExperimentOptimizely
- Conversion Benchmark ReportUnbounce
- Cart & Checkout Usability ResearchBaymard Institute